



Research across four countries shows why immediate facial reactions and later explanations need to be understood together.
A political post can prompt a visible reaction that takes on a different meaning when someone explains it. A facial expression classified as happiness may accompany criticism; surprise may lead to approval, anger or uncertainty. ENCODE’s Work Package 4 explores this distance between reacting to political content and putting that reaction into words.
The findings, presented in D4.2 Generating Emotional Responses and visualised in D4.3 Emotional Maps, offer a practical lesson for democratic communication: understanding how a message is received requires both observation and listening. Across the study, facial-expression patterns differed significantly between country samples, while the statistical analysis did not detect comparable country differences in participants’ dominant interview emotion. [1, 2]
How the research worked
Seventy-six participants in Austria, Bulgaria, Denmark and Poland completed three linked stages: a questionnaire on demographics and political orientation, a biometric session with simulated social-media content, and an individual interview about their reactions. Participants viewed four fictional politician profiles, combining male and female profiles with liberal/future-oriented and conservative/current-oriented material. The design used five posts per profile and approximately two and a half minutes of viewing per profile. Participants were debriefed about the fictional content. [1, Sections 3–4]
Face-tracking classified facial expressions during exposure. Interviews then explored what participants felt, how they interpreted the posts, and what they accepted or questioned. Bringing these sources together allowed researchers to examine agreement as well as differences. Facial-expression classifications are indicators of expressive behaviour, however, and cannot establish a person’s internal emotional state on their own.
Table 1. The WP4 study sample
| Country | Participants | Age range |
|---|---|---|
| Austria | 15 | 20–39 |
| Bulgaria | 16 | 21–31 |
| Denmark | 15 | 20–32 |
| Poland | 30 | 18–35 |
| Total | 76 | 18–39 |
Source: D4.2, Table 1. The sample included 42 women and 34 men; 42 participants had higher education. Recruitment was purposive, so the results are exploratory rather than population estimates.
Four country samples with different response patterns
One of the clearest results was the difference in facial-expression profiles across the four samples. Austria was strongly characterised by surprise classifications, Bulgaria by sadness, and Poland more often by happiness. Denmark showed a mixed profile, with happiness and sadness nearly balanced. Figure 1 makes these patterns visible at the level of stimulus records. [2, Figure 5]
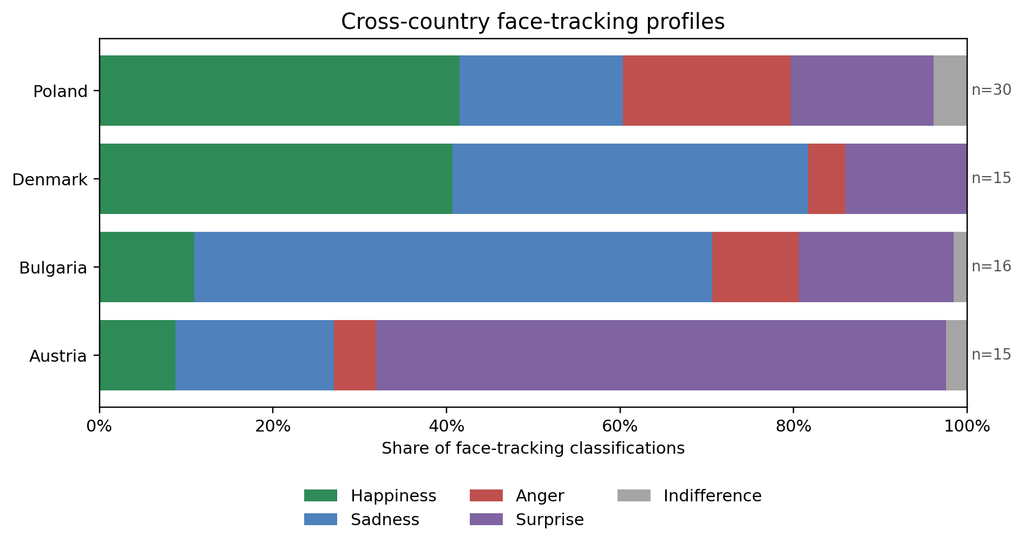
Figure 1. Facial-expression profiles across the four country samples. Reproduced from D4.3, Figure 5. Bars show shares of face-tracking classifications across stimulus-level records; the n labels indicate participants, not the number of independent classifications. Emotion names are the source’s classification labels, not direct diagnoses of feelings.
The participant-level analysis in D4.2 also detected a country association: Fisher’s test with 10,000 Monte Carlo simulations gave p = 0.00009999, conventionally reported as p < 0.001. This supports an overall difference among the samples, but does not establish which individual country pairs differ or what caused the differences. [1, Table 5]
The interviews added a different perspective. In Austria and Denmark, verbal responses to liberal-coded material were more positive in some comparisons, while conservative-coded material attracted more anger or criticism. In Poland, the comparatively happiness-led facial profile coexisted with anger and varied political evaluations in speech. Bulgaria’s sadness-led facial profile became a more diverse mix of emotions and judgements in interviews. These are descriptive tendencies; they do not demonstrate that one political framing reliably produces a particular emotion. [1, Section 8; 2, Section 4]
When facial reactions and spoken feelings diverge
ENCODE calls the distance between its biometric and interview measures the “affect–emotion gap”. In everyday terms, it asks how closely the reaction recorded during viewing corresponds to what a participant later says. The results show limited direct agreement between the emotion categories assigned by the two methods.
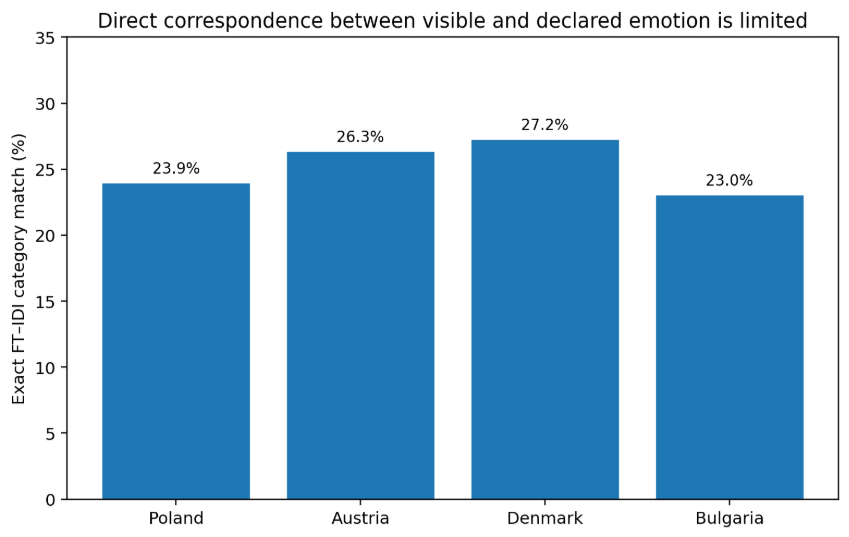
Figure 2. Exact category agreement for comparable stimulus-level face-tracking and interview pairs. Reproduced from D4.3, Figure 7 and Table 6. Agreement ranges from 23.0% to 27.2%. These percentages use comparable coded pairs, excluding records without a comparable pair; they are not percentages of all participants or all stimulus records.
D4.3’s agreement measure adjusted for chance, Cohen’s kappa, was also low: 0.004 in Poland, 0.092 in Austria, 0.062 in Denmark and 0.051 in Bulgaria. A value near zero indicates little agreement beyond that expected from the category frequencies. Separately, D4.2 compared each participant’s overall dominant categories, reporting exact agreement of 10.0%–20.0%. These percentages answer different questions and should not be treated as interchangeable. [1, Table 8; 2, Table 6]
The interviews help explain why simple labels can miss important meaning. The coding category “Other” included scepticism, worry, empathy, disapproval and more complex evaluations. Someone may discuss whether a post is credible or fair without naming one basic emotion. Similarly, a record without a coded verbal response does not demonstrate that the person felt nothing.
D4.2 discusses several possible reasons for divergence, including mixed feelings, reinterpretation, difficulty naming emotions, social expectations and differences between the measurement methods. These are plausible explanations to investigate, rather than mechanisms proven by the statistical tests. Low agreement should not be read as evidence that participants were concealing their “true” feelings. [1, Section 9]
The strongest reaction and the largest gap were not always about the same issue
The country maps also identify topics associated with the highest average face-tracking intensity and those with the largest average gap. War in Ukraine had the highest average intensity in Austria, Bulgaria and Denmark. In Poland, abortion ranked highest. Yet the topics with the largest gaps were different in each sample. [2, Section 4]
Table 2. Topic highlights from the emotional maps
| Country | Highest average intensity | Largest average gap |
|---|---|---|
| Austria | War in Ukraine | Patriotism / WWII |
| Bulgaria | War in Ukraine | Corruption and political instability |
| Denmark | War in Ukraine | COVID-19 |
| Poland | Abortion | War in Ukraine |
Source: D4.3, country synthesis Tables 2–5. Intensity is the face-tracking score used as an arousal proxy in the maps. Topic rankings are descriptive within each sample and the selected stimulus set.
This distinction matters when designing a public discussion. Facilitators can explore both the immediate reaction and the meaning participants later give it, asking how their interpretation shaped their response.
Denmark had the highest descriptive mean gap in D4.3, at 3.86, followed by Austria at 3.49, Poland at 3.11 and Bulgaria at 2.97. These study-specific scores are not percentages. The distributions overlap, and the evidence does not establish a systematic national ranking. [1, Figure 24; 2, Figure 6]
What the statistical tests tell us
A p-value describes how compatible the data are with a null hypothesis, such as no association. Values below the conventional 0.05 threshold flag statistical significance, not the size or importance of a difference. Values above 0.05 do not prove that no association exists.
Table 3. Selected statistical findings from D4.2
| Question tested | Test and result | Plain-language reading |
|---|---|---|
| Did dominant facial categories vary by country? | Fisher + Monte Carlo p = 0.00009999 | Evidence of an overall association across the country samples. |
| Did dominant interview emotions vary by country? | Fisher + Monte Carlo p = 0.4958 | No statistically significant country association detected. |
| Were dominant facial and interview categories associated? | Fisher exact p = 0.4268 | No statistically significant association detected between the two dominant categories. |
| Was the gap associated with economic orientation? | Spearman ρ = 0.0597 p = 0.6107 | No significant association detected. |
| Was the gap associated with social orientation or age? | Spearman p = 0.916; p = 0.797 | Neither association was statistically significant. |
| Did the gap differ by gender or education? | Mann–Whitney p = 0.7214; p = 0.9321 | Neither comparison was statistically significant. |
| Did the gap differ across the four gender–education groups? | Kruskal–Wallis p = 0.5195 | No significant difference detected across these groups. |
Sources: D4.2, Tables 5–7 and Sections 9.2 and 12.2. Monte Carlo tests used 10,000 simulations because small category counts made the usual chi-squared approximation unsuitable. These are reported analyses, not new tests of the pooled stimulus records.
The country association in facial classifications also remained significant when liberal- and conservative-coded profiles were analysed separately (both p < 0.001). The corresponding country tests for interview emotions were not significant (p = 0.8085 and p = 0.5603). These compare countries within each profile type; they do not test whether liberal content outperforms conservative content. [1, Table 7]
Exploratory models combining age, gender, education and political-compass scores were not significant overall for facial categories (p = 0.41) or interview categories (p = 0.325). Isolated significant coefficients therefore provide no firm basis for claiming that a demographic group or political orientation predicts a particular emotional response. [1, Section 12.2]
How these findings can support democratic dialogue
For communicators, the findings support testing how a message is interpreted as well as whether it attracts a reaction. A happiness classification alone cannot establish agreement, trust or persuasion. Interviews can reveal whether an apparently engaging message was experienced as convincing, uncomfortable, unfair or untrustworthy.
For ENCODE’s Citizen Innovation Labs, the emotional maps offer concrete starting points for discussion. Participants can explore the difference between an initial response and a later judgement, compare interpretations of sensitive topics, and consider language that acknowledges concern without intensifying hostility. D4.3 also positions the maps as inputs to WP5 survey development, WP7 foresight and policy workshops, and WP8 communication activities. These are uses of the findings, rather than evidence that the proposed approaches have already reduced polarisation. [2, Sections 1.4 and 6]
Reading the findings in context
The study involved a small, purposively recruited sample, mostly young adults, with a political-compass distribution concentrated in the left-libertarian quadrant. Country samples differed in size and composition. Controlled viewing also differs from everyday scrolling, and language, translation and facial-expression classification can affect comparisons. The 1,522 stimulus-level records described in D4.3 came from 76 people; repeated records do not constitute 1,522 independent participants. [1, Sections 4, 6 and 12; 2, Section 2]
The findings therefore offer an exploratory basis for better questions and larger studies. They do not establish national emotional traits, causal effects of ideology, or the superiority of a particular narrative. What WP4 provides is a richer way to examine political communication: consider the immediate expression, listen to the person’s explanation, and investigate the relationship between them.
Sources
[1] ENCODE. D4.2 Generating Emotional Responses. Supplied project deliverable; especially Sections 3–4, 7–12, Tables 1 and 5–8, and Figure 24.
[2] ENCODE. D4.3 Emotional Maps. Supplied project deliverable, ENCODE_D4.3_Emotional_Maps_final_08.05.2026.docx; especially Sections 2–6, Tables 2–6, and Figures 5–7. Figures 1 and 2 in this article reproduce D4.3 Figures 5 and 7.